Archive for the ‘Tool Tips’ Category

KCacheGrind

Tool Tips | Posted by attriel June 1st, 2010

Well, here’s the large KCacheGrind pics.  In order to get good pics, I installed WordPress and logged it!

So, here we go.

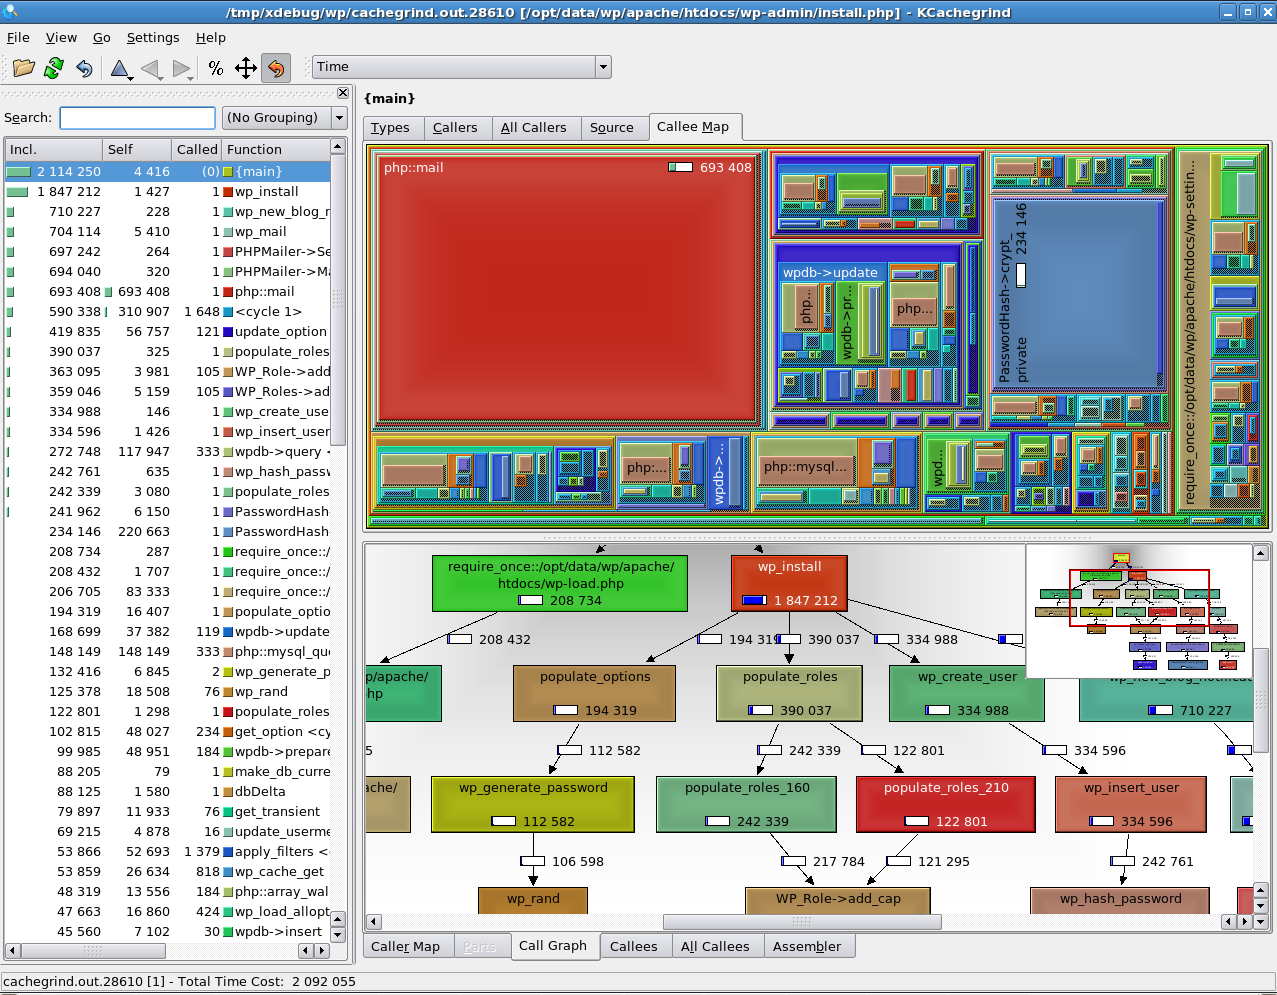
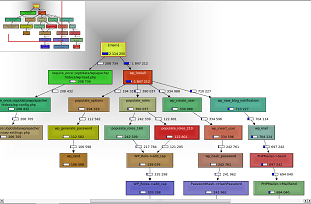
The first image is from the installation script.  I created the db & user, and unzipped the files.  This is what happened from the wp-admin/install.php script:

The top half has the display of “caller map”; it shows everything being called.  Each box is scaled to the quantity of time used by the function.

The second half shows the “caller graph”; at the top is “main” and then it trees to each call, which calls down.

The left-hand is the plain listing.  It shows a lot of the same data from the trace files.  Inclusive-time, is the first column.  This is the complete time spent in this function, including all subs.  The second is the amount of time spent actually in this function, followed by total number of calls.  The last one is the function name, the very beginning is a bar-graph representation of the total time.

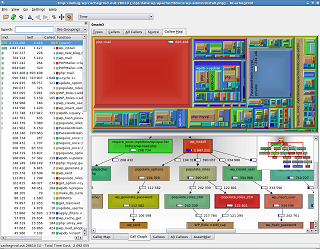
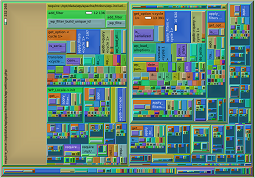
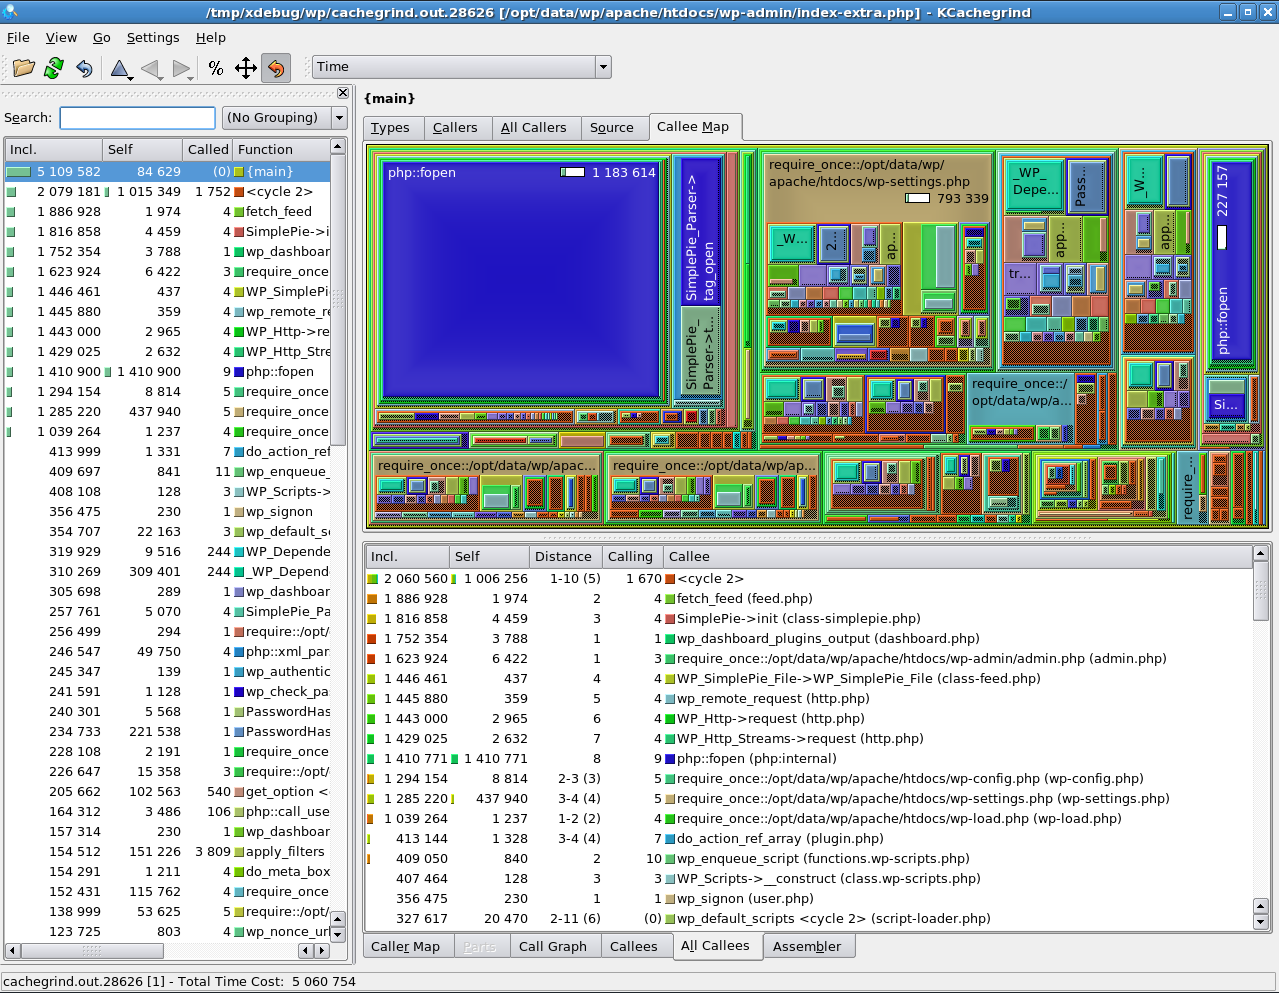
The second image was from the admin login page.

This is a similiar picture to the first.  The top is the callermap again.  The bottom shows the functions called.   In this entry, we’re seeing the callees off of main.

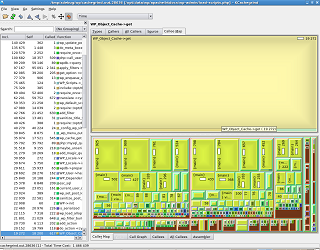
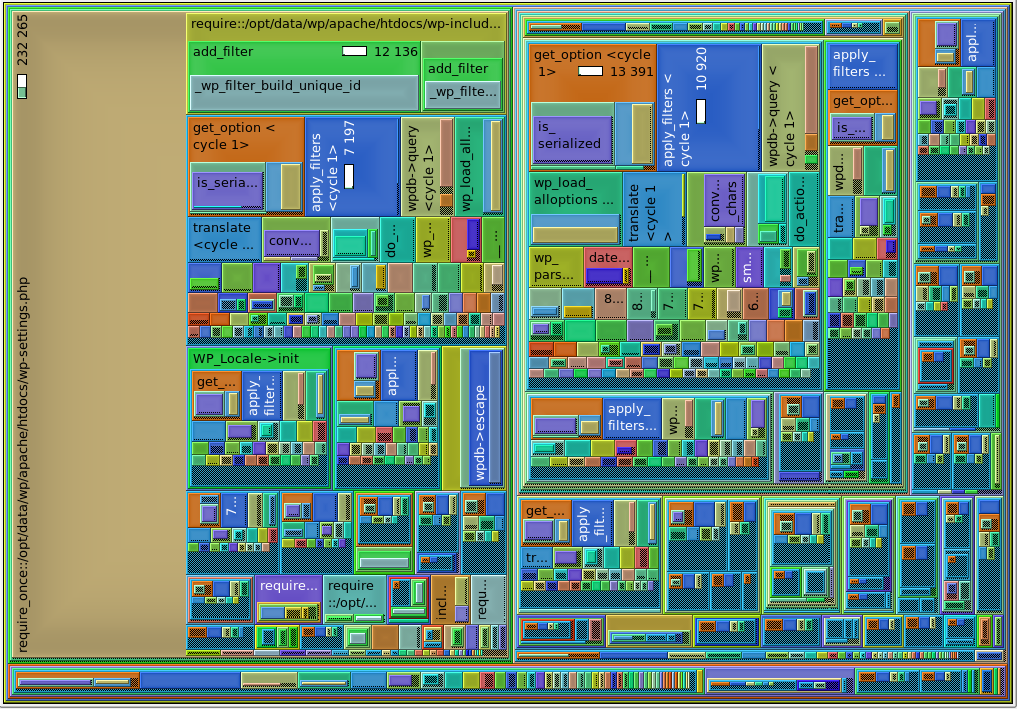
The third image is from adding a new post the the blog.

This time I zoomed in on a function (WP_Object_Cache->get) , which is why the upper panel is so empty.  There are actually two sub-calls up there on the bottom edge, but they’re really small, hard to see.

The lower pane is the “caller map”, which is kindof the opposite of the upper panel.  In this case, everything that calls the Cache Get, which in this instance is a huge number of calls from “main.”

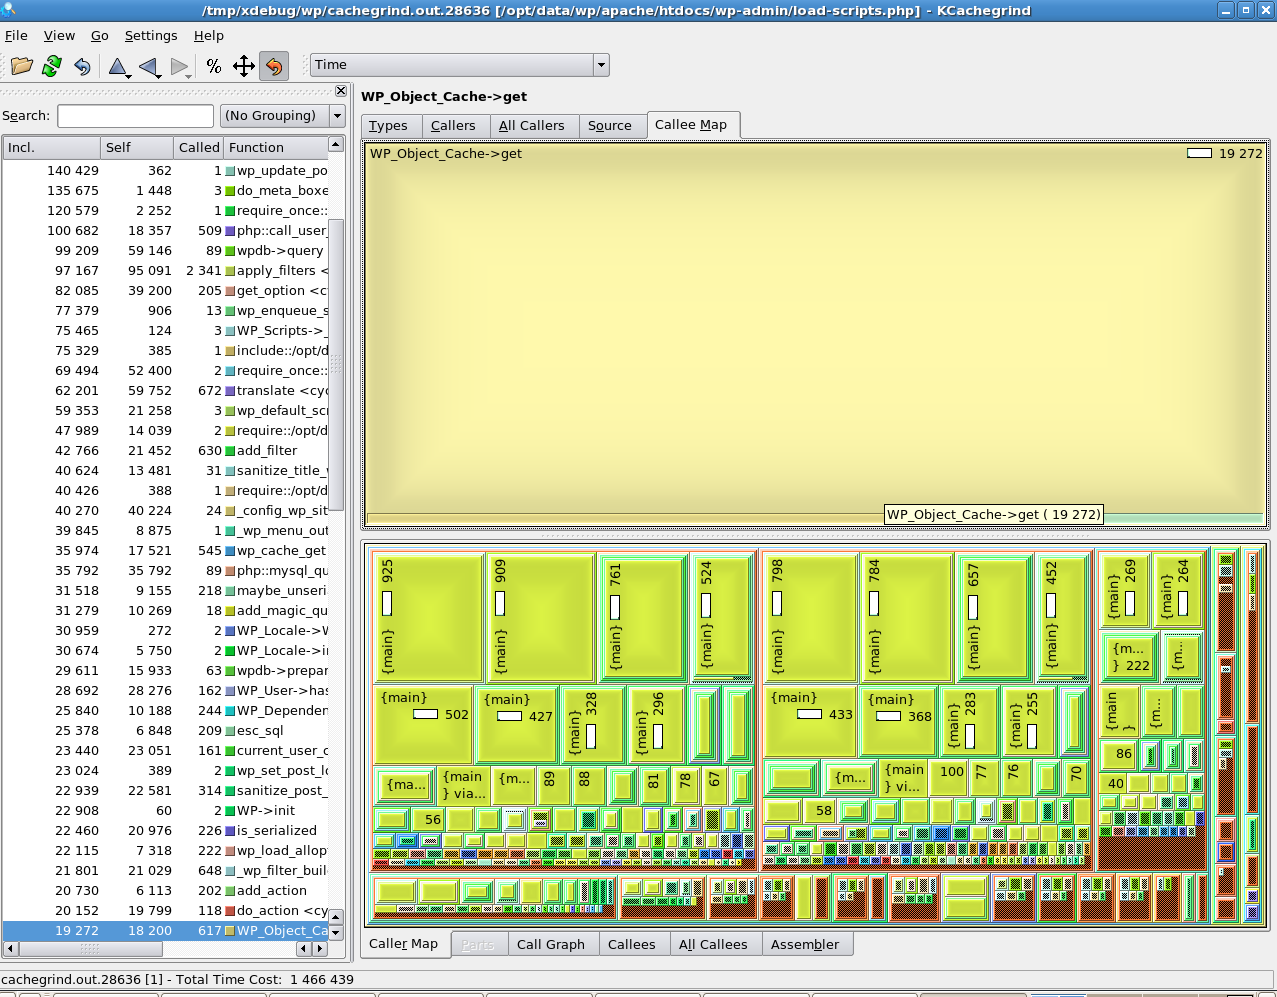
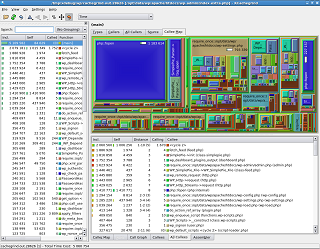
The fourth picture is from the homepage of the new installation.

I cropped it to just the upper pane.  This gives us a good view of exactly HOW MUCH goes into the homepage.  With only two posts (the default post and the one I created), it is just a huge listing.  The dark-blue speckled areas are where it ran out of things to fill into the field, because it couldn’t always slice the page in reasonable ways.

I never quite was able to configure the system to make thumbs for me, so the images above don’t link around to the full-size pics.  The gallery is inserted below, but I couldn’t figure out how to get the thumbs out of the gallery, so everything is listed twice.  Sorry.

Open CA, continued

Coding, Tool Tips | Posted by attriel March 16th, 2010

Well, I haven’t had a chance to look at the entries I mentioned last post.  But I DID remember an open free Certificate Authority.

CA Cert, it’s a site that allows you to register and, assuming you can reasonably proof ownership of your domain (by answering the emails associated with the registrar), then you can issue certs for your domain.  I’m currently looking at issuing certs for my mail server and web daemon.

The CACert Root Certificate isn’t widely distributed, so your users would have to add it the first time they came, but IMO it’s a little better (and possibly more well controlled) than the self-signed “Snake Oil” certs.

The only downside, that I’ve noticed so far, is that there’s no interface for building your request.  So you still have to use OpenSSL or another package to generate your Cert Req and the CSR.  I’m kindof surprised, honestly, that they don’t have that part, since that would be easier than the CA portion I would think.

So, I still want to look at the other tools, but since CACert is centralized and you can add the root cert for your users, I think it makes a decent option when you can use it.

CA Systems

Coding, Tool Tips | Posted by attriel March 3rd, 2010

So, as part of the MySQL SSL Replication series, I decided that I’d look up some open source CA systems.  Because there must be something better than running openssl –fifty –thousand –options –with –no –memory –or –chceking

I found OpenCA/OpenPKI ,which looked interesting.  Except as I tried to set it up, the Ubuntu distributions were in Redhat RPMs, and after converting them they don’t appear to be actual apps.  They may have been framework prereqs of the app.  But the downloading screens were singularly uninformative.

I also found EJBCA, which I haven’t tried out yet.  Partially because OpenCA sounded decent, and I figured I’d try that first, since EJBCA looks to be a much larger Java/jboss application, and I don’t know JBoss offhand.  I’ll let you know if I get it going, otherwise I’ll do the MySQL entries with openssl.

And I meant to post this yesterday, oops.

Logfile Visualization

Tool Tips | Posted by attriel February 2nd, 2010

One thing I’ve been looking for, on and off, is some way to view a representation of the server logs in realtime.  Basically something I can take a look at and see what’s happening.  Also, playback at a later date to see what happened at a given time.

One of the only things I found that really did that was glTail.rb, a Ruby program.  I don’t have a lot of Ruby knowledge, so I didn’t go very far with it to see how it ticks and what I could modify.

It runs the log and streams bubbles from one side representing the server traffic.  Size is determined by request/response size.  I never quite figured out what the other set of streaming bubbles really represented, since Ruby isn’t in the environment I was playing in.  As a general use tool, it seems like it would be interesting if you had all the pre-reqs installed already.  As an industry tool, I wasn’t convinced that I saw enough benefit to justify installing the prereqs.

But I don’t think “industry level” even wants a tool like this, so !

I think the most telling video is the one discussed on the slashdotting page.

XDebug

Tool Tips | Posted by attriel January 26th, 2010

This is throwing back to our previous discussion about code profiling

The tool we’re using, and which provides a lot of functionality that we really like, is XDebug.  This one, unlike APD, doesn’t appear to have an on/off runtime setting; we activate it in php.ini and it just goes.

Also, for various reasons, patching even our dev systems is a complicated and annoying process.  Luckily, we’ve mostly turned the development system into “integration”, and we all do our development on local developer workstation servers.  So we’ve patched our locals to add XDebug

zend_extension=/opt/php-5.2.6/lib/php/extensions/no-debug-non-zts-20060613/xdebug.so

xdebug.profiler_enable=1
xdebug.profiler_output_dir=/tmp/xdebug/
xdebug.profiler_append=1
xdebug.show_mem_delta=1
xdebug.trace_output_name=trace.%p
xdebug.trace_output_dir=/tmp/xdebug
xdebug.trace_options=1
xdebug.trace_format=1
xdebug.auto_trace=1

That’s activation.  Obviously the zend-extension path is just what is on my local system, it varies.

zend_extension adds it to the PHP interpreter at a base level, so it always works.

profiler_enable — turns it on

profiler_output_dir, trace_output_dir, and trace_output_name  tells it where to put the files it generates

profiler_append (& trace_options) — This flag is necessary because otherwise another process on the same interpreter (apache process) will, by default, overwrite the file.  append allows you to have it just keep adding.  It will confuse your numbers later, but I found it a little safer when I set it up.  Our other primary user has it not appending.

trace_format — this defines what format the output file should be in.  The default (0) is the human readable format.  I could never figure it out.  1 is actually the COMPUTER format, but I find it easy to read.  YMMV

show_mem_delta lets you see how the memory utilization changes between calls in the human format of the trace.

The trace file:

Version: 2.0.4
TRACE START [2010-01-22 20:12:05]
1 0 0 0.014269 53424 {main} 1 /opt/data/localhost/apache/htdocs/php.php 0
2 1 0 0.014295 53448 phpinfo 0 /opt/data/localhost/apache/htdocs/php.php 1
2 1 1 0.404662 58100
1 0 1 0.404689 58100
0.404764 26700
TRACE END   [2010-01-22 20:12:05]
The first column (1 2 2 1) is the depth of calls.  The second (0 1 10) is the function call # (IIRC this is monotonically increasing throughout the program).  Column 3 (0 0 1 1) is Enter/Exit (0 is Enter, 1 is Exit).  Column 4 is elapsed execution time. (The fifth row actually starts here)  Fifth is Current Memory Utilization.  Six is the call that got us to this entrance (the remaining columns are null on exit).  Seventh is User (1) or Internal (0).  Eight and Nine are source file & Line Number that invoked.

The profile file:

==== NEW PROFILING FILE ==============================================

version: 0.9.6

cmd: /opt/data/localhost/apache/htdocs/php.php

part: 1

events: Time

fl=php:internal

fn=php::phpinfo

1 390321

fl=/opt/data/localhost/apache/htdocs/php.php

fn={main}

summary: 390388

0 66

cfn=php::phpinfo

calls=1 0 0

1 390321

This file is significantly less human readable than the last.  It IS however good for visualization with a tool such as KCachegrind (the file is actually named cachegrind.pid).  That will be the next ToolsDay post.  Because this one is already large, and that one has pictures!

Advanced PHP Debugger (APD)

Tool Tips | Posted by attriel April 21st, 2009

The first Code Profiler we looked at was the Advanced PHP Debugger (APD).  (http://pecl.php.net/apd) Which I insist on calling ADP for some reason.  This one had a lot of features that looked interesting, and had a single function call for turning it on or off.  Something we could add to the pages we were interested in checking, or to our config to profile the complete set.

Unfortunately, the project looks to have been abandoned, with the last release (1.0.1) being from 2004.  We tried setting it up anyway, the zend hooks still existed AFAICT and it’s not unreasonable to believe that profiling data would be reasonably unchanging.  The rest of the “Debugger” might be out of date, but perhaps profiling would work.

As it turned out, apparently not ALL of the zend hooks still existed in the same form, and so every page load simply crashed PHP and the apache process managing the connection.

New Category

Site Maintenance, Tool Tips | Posted by attriel April 7th, 2009

So, I think one thing I need to do is set up some new guidelines.  so one thing I’m going to do is create some new categories and set up some regular “features.”

To wit:  I’ve added “Tool Tips”, which is a category I’m going to use for posting about various programming or security tools I find and use.  Sort of a cross between overviewing and my personal review of it.   Not going to get all fancy dance with “4 shebangs up!” or fancy pics or anything, but will be posting my thoughts and opinions on the pieces.

And I’m going to currently lay that out as every first and third Tuesday.  I think that’s a reasonable frequency right now, two tools a month I think I can hit that.  And I’m hoping to set up some pipelined posts during the hiatus (like this one, for instance). And hopefully that will give me a little leeway in case I don’t hit up any new tools immediately.

Actually, now I almost want to make a graphic and do 4-shebangs out of 7 or something …